ProxyMapService now logs HTTP/2 traffic the same way it logs HTTP/1.1: headers, bodies and the completion of every request show up in the same logs and the monitor, with nothing extra to configure.
What changed
Until now, only HTTP/1.1 traffic was visible in the log and the monitor. If both the client and the server spoke HTTP/2, the tunnel simply forwarded the bytes and nothing was left in the log. Traffic still flows through unchanged, but the proxy now reads a copy of it and hands it to the same loggers.
| Scenario | Before | Now |
|---|---|---|
| HTTP/1.1 client, HTTP/1.1 server | logged | logged |
| HTTP/1.1 client, HTTP/2 server (translation) | logged | logged |
| HTTP/2 client, HTTP/2 server | not visible | logged |
Files from RootDir over HTTP/2 |
the client received garbage | served correctly |
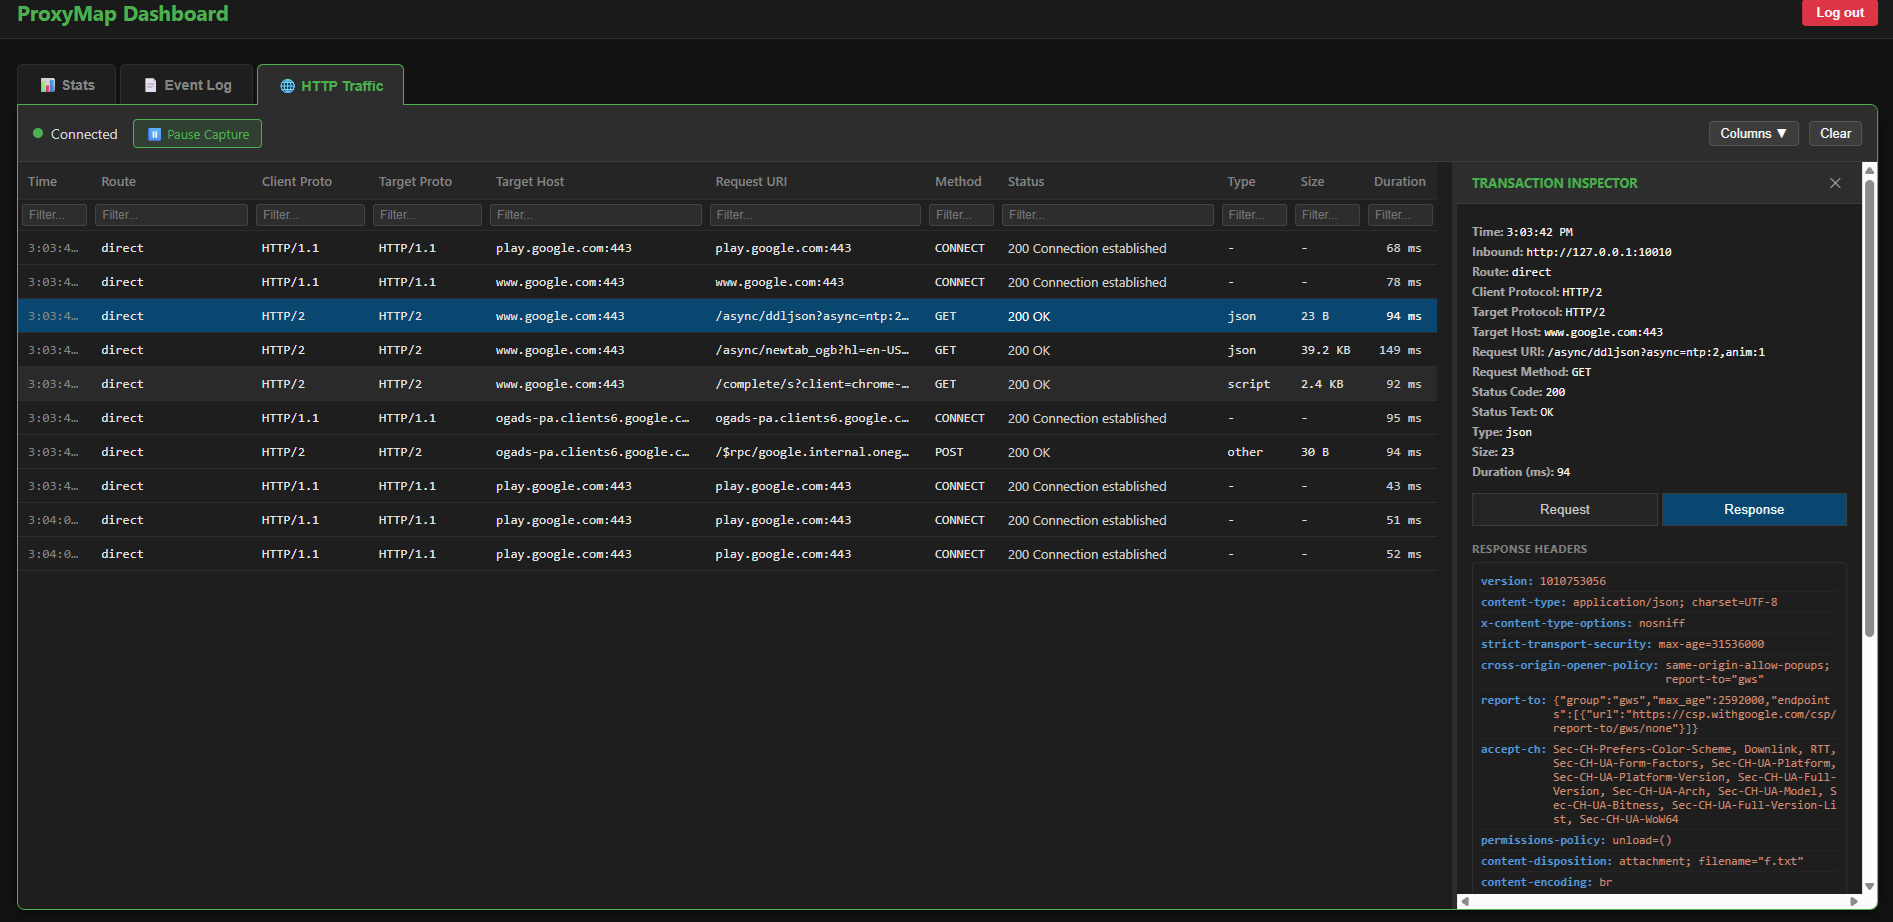
The HTTP Traffic tab: client and server both speak HTTP/2, and the response is inspected in the Transaction Inspector.
One more fix applies to every protocol: the “request completed” event is now delivered for each request, not once per session. Previously, when several requests shared one connection (keep-alive, and HTTP/2 even more so), the monitor could receive the completion only for the last one.
What goes into the log
For every HTTP/2 request the proxy passes the same things to the loggers as for HTTP/1.1:
- request and response headers;
- request and response bodies, if a body logger is enabled (without one, bodies are not accumulated);
- request completion, separately for each request, even when dozens run in parallel on one connection;
- URL matches for subscriptions (
NotifyIfRequestUrlMatches).
To keep the log readable, HTTP/2 headers are shown in the familiar form: the request as GET /path HTTP/2, the response as HTTP/2 200 OK. The server name comes from :authority and is shown as host, and multiple cookie headers are merged into one.
The monitor shows which protocol the client speaks (the Client Proto column) and which one the server speaks (Target Proto). With translation it is HTTP/1.1 → HTTP/2; with transparent h2 it is HTTP/2 → HTTP/2:
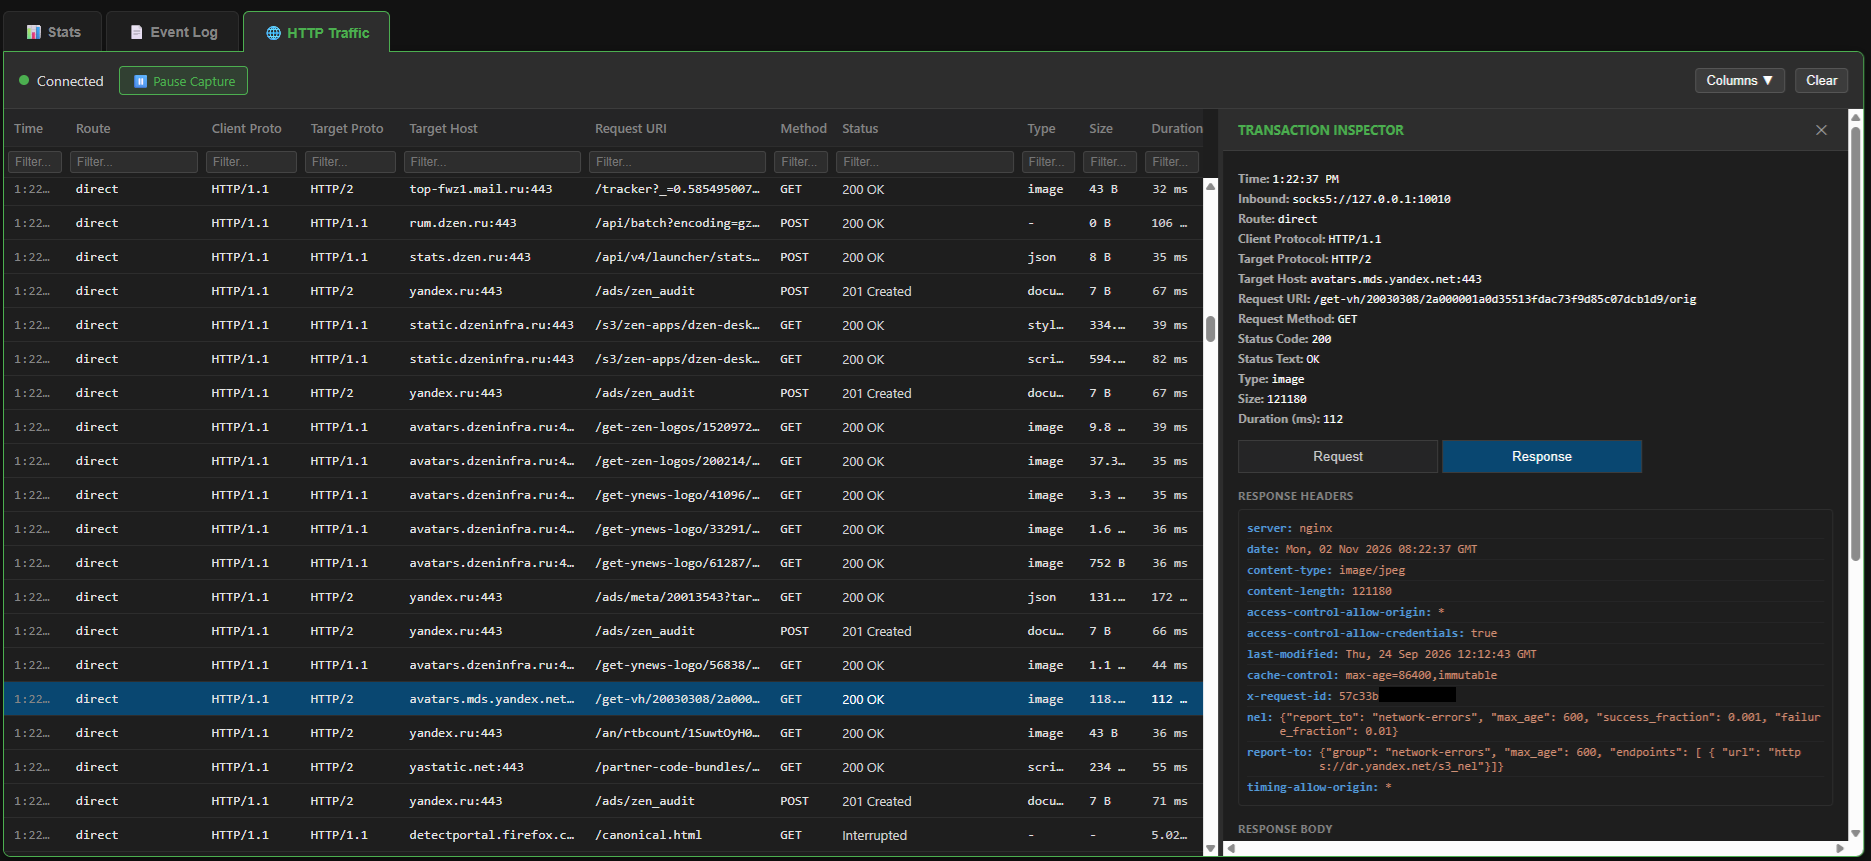
At Debug level, one summary line is written per request:
[h2 stream 5] GET /api/items -> 200, request 0 B, response 4821 B, 37 msAlso at Debug level you can see individual requests being aborted (RST_STREAM) and the connection being closed (GOAWAY) with its error code.
How to enable it
There is no separate setting: observation switches on by itself when a session runs on HTTP/2 on both sides. Three conditions must hold:
- TLS decryption is enabled (
DecryptSSL). Without it the proxy sees only encrypted bytes and there is nothing to parse. SslClientOptions.ApplicationProtocols(what the proxy offers the server) includesh2.SslServerOptions.ApplicationProtocols(what the proxy allows the client) includesh2too.
If the client supports h2 and the server picks h2, the session runs as transparent HTTP/2 and the proxy starts observing it. How protocols are negotiated for every combination of settings is covered in the post about HTTP/1.1 → HTTP/2 translation, which has a table of scenarios.
Recommended starting point: http/1.1,h2 in both SslClientOptions and SslServerOptions. Browsers will use h2, clients such as curl will stay on HTTP/1.1, and logging works in both cases.
For FileRequestHandler (when the proxy itself serves files from RootDir) it is also enough to put h2 in SslServerOptions.ApplicationProtocols: the browser negotiates HTTP/2, and the files are served over it.
Cache and Host override
Observation changes nothing in the traffic, but the cache and Host override need to intervene: serve a ready-made response or rewrite the address in the request. For now only HTTP/1.1 can do that, so for such sessions the proxy offers the client HTTP/1.1 by default, even if it supports h2. Towards the server the proxy speaks h2 if translation is enabled, and HTTP/1.1 if not. Both downgrades are on by default, and each can be turned off with its own setting in the HTTP section:
DisableDowngradeToHttp1ForOverwrittenHost— Host override. By default (false) the client is downgraded to HTTP/1.1 when an override is set for the host, and the override works. Withtruethe client stays on h2, and Host override does not take effect in such a session.DisableDowngradeToHttp1ForCache— the cache. By default (false) the downgrade is on, and the cache works even for browser h2 traffic. Withtruethe client keeps using h2, and the cache does not take effect in such sessions.
{
  "HTTP": {
    "DisableDowngradeToHttp1ForCache": false,
    "DisableDowngradeToHttp1ForOverwrittenHost": false
  }
}
When a downgrade happens, the log records that the client was offered HTTP/1.1. If the client does not support HTTP/1.1, or the ALPN settings do not allow it, the proxy logs a warning that the downgrade is impossible.
If something goes wrong
Observation cannot break your traffic: the bytes are always sent to the recipient first, and the analysis happens after them. If the proxy cannot parse something unusual, only the log suffers, not the session. Two warnings may appear in the log:
| Message | What it means |
|---|---|
[h2] traffic analysis stopped for … |
Parsing of one direction (requests or responses) stopped until the end of the session. Traffic keeps flowing, but that direction is no longer logged. Usually this is a malformed stream from the client or the server. |
cannot build an HTTP header for logging |
A header for the log could not be built for a single request (for example, an invalid status). That request is not recorded; the others work as usual. |
If the first message keeps appearing for the same host, look at the reason in the log message: it points to a specific protocol violation and helps find the problematic server.
Limitations
- Observation only watches: the cache and Host override do not work in transparent h2→h2 (see the downgrade to HTTP/1.1 above).
- Bodies are accumulated in memory in full until the request ends, so large uploads with a body logger enabled take as much memory as the body itself.
- Individual service frames (
PING,WINDOW_UPDATE,SETTINGS) are not logged: you see only requests and responses, plusRST_STREAMandGOAWAYat Debug level. - After a parsing failure in one direction, the rest of the session is not logged in that direction.
- At most 2048 concurrent requests are tracked per connection; this limit protects memory from a peer that opens streams endlessly.